What kind of questions does it solve?
We all know that sometimes we need to achieve certain goals, such as minimising the cost or maximising the profit. Then there’re some restrictions like time, human resource, etc.
If we use the math language to describe it, it could be:
Minimise 10*X1+25*X2+32*X3
X1+X2+X3 =20
X1+X2 >=4
x2+X3 >=5
x1+X3 >=3
X1,X2,X3 are integers
Process
Enable the solver function
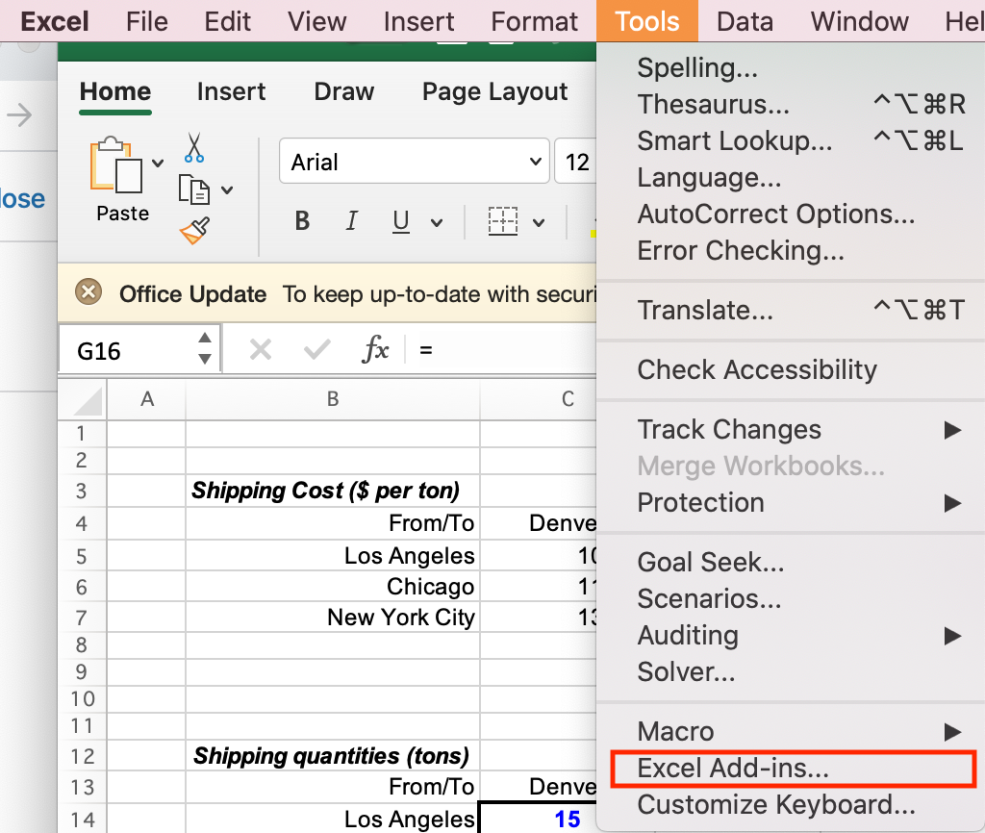
Solver is an add-in feature of Excel. So before we use this tool, you need to make sure you have this add-in. Here shows every step that you will take if you haven’t used Solver ever.
Click ‘Excel Add-ins…‘ in the Tools menu.
In the pop-up window, check ‘Solver add-In‘. And click OK to confirm.

Import the data
Here’s an example taken from Warton Business School’s MBA course.
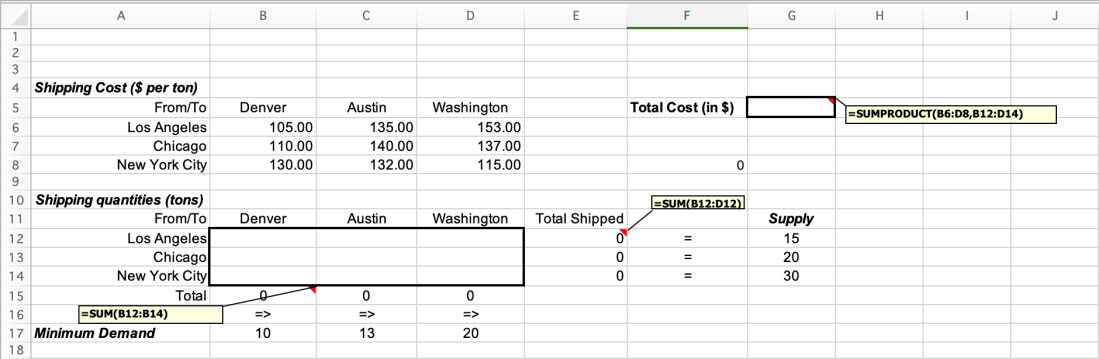
Basically, you can organise information in the table shown below. Shipping quantities are changing but constrained to several conditions. Our goal is to minimise the total cost.
Create the Solver model
Find ‘Solver’ in Tools and click it.

In ‘Set Objective’, click the cell that you want to calculate the total cost. Don’t forget to put the formula in it:’=SUMPRODUCT(B6:D8,B12:D14)’
Then select ‘Min’ as in this case, we are finding the min.
For ‘Changing Variable Cells’, select the whole blank area in the middle.
Because in the constraints area, you cannot write $B$12 + $B$13 +$B$14 >= $B$17, so we introduced Total: $B$15, which replaces the left part of the formula. Similarly, Total Shipped is created.
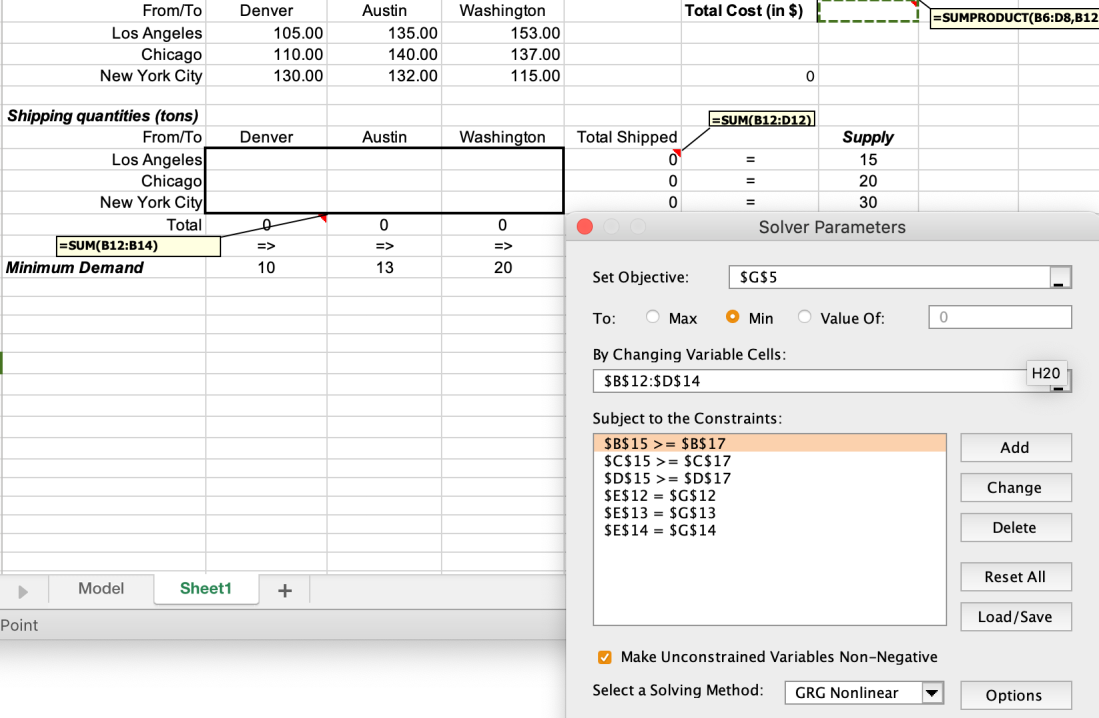

After this is all completed, click ‘Solve’.
Get the result

The left bottom area shows the status of Solver.
After it completes running, you will see:

Because we haven’t run it before, so we keep Solver Solutions.
One trick for you, if you want to test different scenarios, you can click ‘Save Scenarios’ and then compare results.
From final results, we can clearly see that the optimised value and corresponding variables are highlighted in red and blue color.
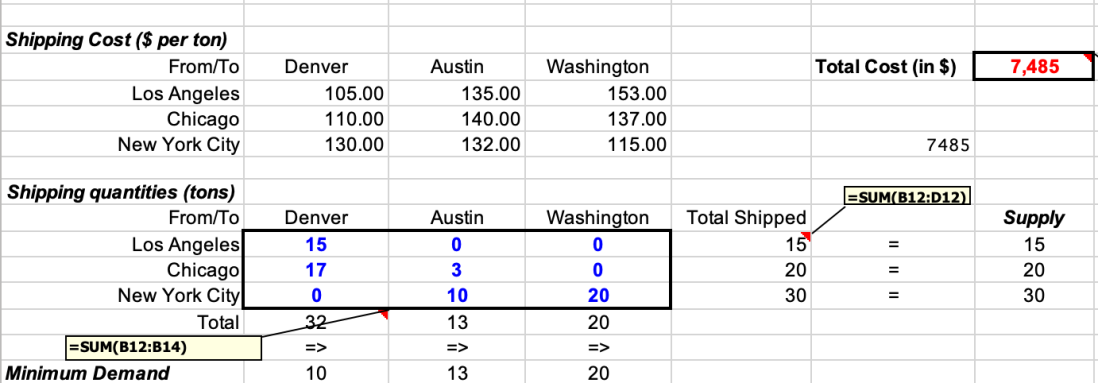
Congratulations! You just solved a problem with Solver!
